Summary functions
Summary functions are used in data grids to display statistical summaries of column data.
Right-click on a data grid column to open the context menu and then expand the Summary functions submenu.
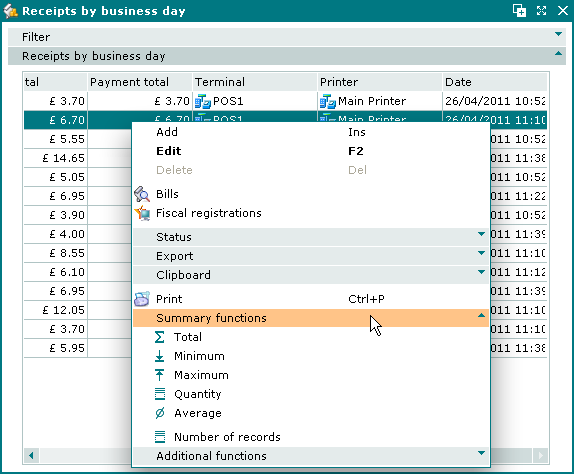
Summary functions submenu
Summary functions submenu commands:
Total — sum of all numerical values (except dates) in the column.
Minimum — minimum numerical or date value in the column.
Maximum — maximum numerical or date value in the column.
Quantity — number of non-empty rows in the column.
Average — average of all numerical or date values in the column.
Number of records — total number of rows in the data grid. Displayed in a separate bar and not related to any columns.
Commands that are not applicable to the type of data in the column are displayed in faded grey.
Numerical values include dates, but do not include numbers or dates that are displayed as text string values (e.g. document ID numbers, dates used as business day names, etc.).
Summary values are displayed below columns in horizontal bars at the bottom of the data grid:
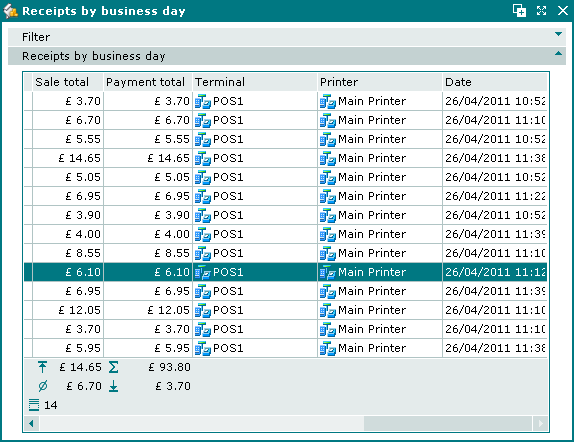
Summary functions in use
Multiple summary functions can be enabled on each column. As many horizontal bars as necessary will be added to display all the summary values.